NYC standardized test results: The total number of tests by grade viewed by cohort
Saturday November 16, 2013
After removing District 75 results, this continues the investigation of total numbers of tests reported in the NYC data.
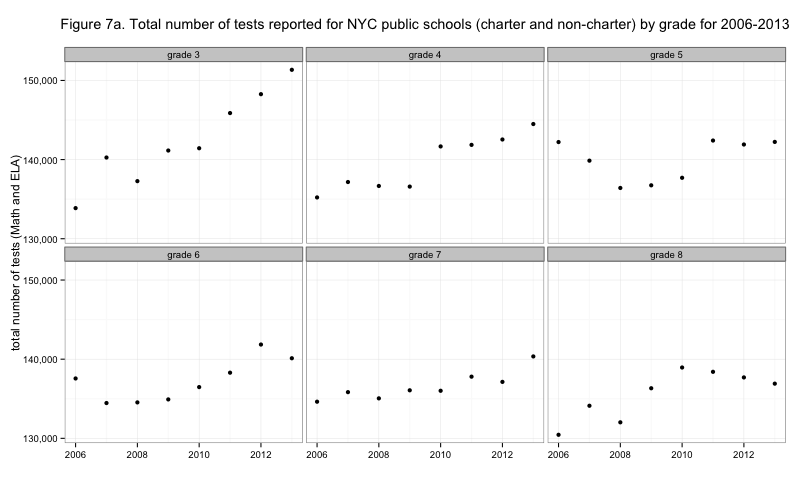
Figure 7a. Total number of tests reported for NYC public schools (charter and non-charter) by grade for 2006-2013
Looking at the number of tests given for each grade over time, we hope to see some pattern. But this is a somewhat limited way to look at the data. Observe that the number rises quite a bit for grade 4 between 2009 and 2010. And the number rises for grade 5 between 2010 and 2011. And it rises for grade 6 between 2011 and 2012. It's like looking at a flip-book pages of something moving left to right.
What's moving, of course, is a cohort of students. Usually the students in third grade in one year will be in fourth grade the next year. So we would like to compare the third grade of 2006 to the fourth grade of 2007, and so on. A simple calculation gives us a cohort identifier, which will be represented as the years during which a student would be tested for grades 3 to 8 assuming normal passage from grade to grade. For example, a student in the "2008-2013 cohort" started third grade in fall of 2007, took the third-grade test in spring of 2008, and eventually took the eighth-grade test in spring of 2013. We have complete data for three cohorts and incomplete data for ten cohorts, five of which may yet be completed, the other five of which have already moved on to high school and beyond.
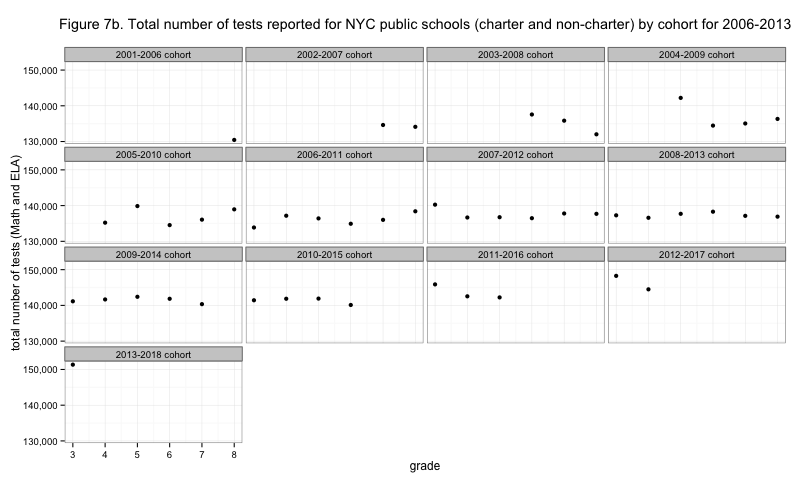
Figure 7b. Total number of tests reported for NYC public schools (charter and non-charter) by cohort for 2006-2013
If Figure 7a is like flip-book pages, Figure 7b is like single-image traces of everything that was moving. This idea of cohorts will be even more important later when thinking about changes in scores. Importantly, there is apparently more variability in the number of tests per grade over time than in the number of tests per cohort over time, which makes sense. A direct comparison will make this even clearer:
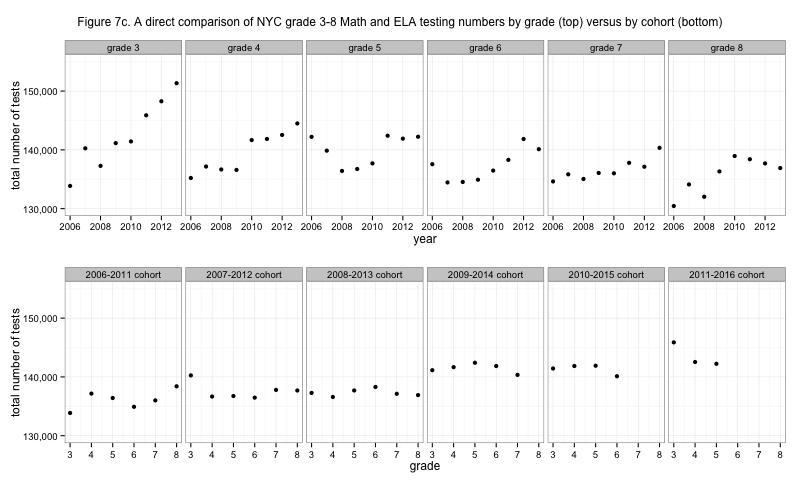
Figure 7c. A direct comparison of NYC grade 3-8 Math and ELA testing numbers by grade (top) versus by cohort (bottom)
Viewed this way it's apparent that the 2009-2014 cohort is markedly larger than the 2008-2013 cohort. To see this in the top here, equivalent to Figure 7a, we make many small grade judgements and it is more difficult to see the underlying phenomenon driving the action. Also, with the cohort view we preserve much of what was interesting about Figure 5b - perhaps even in improved form - since we can see the occasional drops in testing from grade 3 to grade 4, but we see them in the appropriate context. Viewing by cohort encourages the relevant comparisons.
[table of contents for this series]
This post was originally hosted elsewhere.