Try HoloViz for Python plotting
Friday November 26, 2021
Yang inspired me to check out HoloViz, which makes it easy, among other things, to do interactive scatterplots in Jupyter Notebooks—and stick them in any HTML!
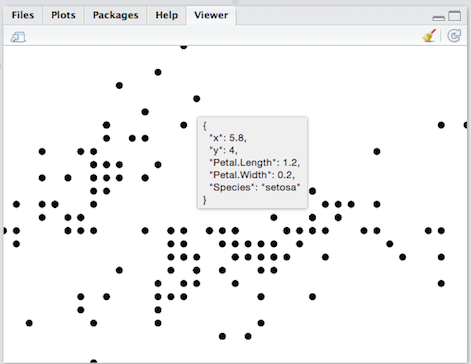
I've wanted this to be standard functionality for a long time; six years ago I briefly started a project that included it in its proof of concept, as in this screenshot:
The interactive example above is the hvPlot Scatter example saved to HTML as in Saving plots (code is on GitHub) and then copy-pasted into my blog Markdown file. The interactive plots unfortunately don't show up in GitHub's Jupyter Notebook preview.
hvPlot is just one corner of HoloViz and related packages, but the interactive scatterplot functionality alone is enough for me to be a big fan.