Simple diff-in-diff
Sunday October 31, 2021
Things are always changing. Difference in differences tries to identify how much of a change is due to some treatment by comparing to a control that's also changing over time.
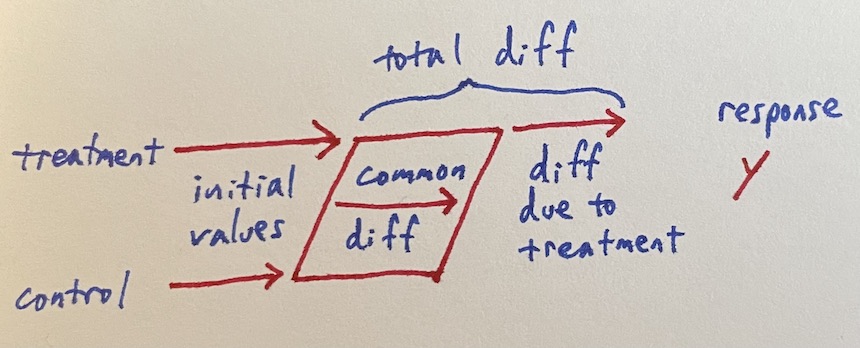
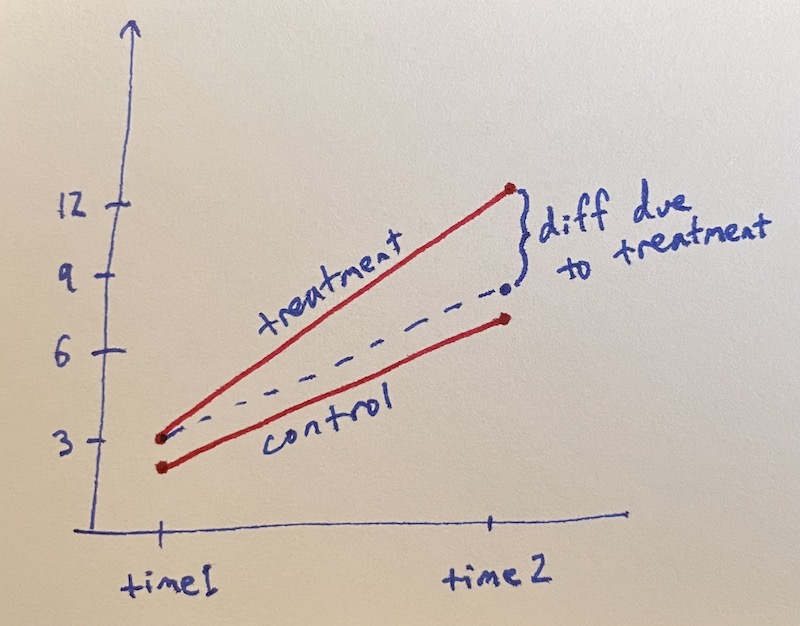
This is often presented graphically with response value against time.
A noiseless design matrix illustrates how this becomes a diff-in-diff regression.
| treatment base | control base | common diff | treatment diff | response |
|----------------|--------------|-------------|----------------|----------|
| 1              | 0            | 0           | 0              |  3       |
| 0              | 1            | 0           | 0              |  2       |
| 1              | 0            | 1           | 1              | 12       |
| 0              | 1            | 1           | 0              |  7       |
Real data will have noise; here's a simulation in R.
treatment_base = c(rep(1, 100), rep(0, 100), rep(1, 100), rep(0, 100))
control_base   = c(rep(0, 100), rep(1, 100), rep(0, 100), rep(1, 100))
common_diff    = c(rep(0, 100), rep(0, 100), rep(1, 100), rep(1, 100))
treatment_diff = c(rep(0, 100), rep(0, 100), rep(1, 100), rep(0, 100))
response = c(rnorm(100, mean=3),
             rnorm(100, mean=2),
             rnorm(100, mean=3) + rnorm(100, mean=5) + rnorm(100, mean=4),
             rnorm(100, mean=2) + rnorm(100, mean=5))
summary(lm(response ~ treatment_base + control_base + common_diff + treatment_diff + 0))
##                Estimate Std. Error t value Pr(>|t|)
## treatment_base   3.0747     0.1367   22.50   <2e-16 ***
## control_base     1.9798     0.1367   14.49   <2e-16 ***
## common_diff      5.0990     0.1933   26.38   <2e-16 ***
## treatment_diff   3.9453     0.2733   14.44   <2e-16 ***
Diff-in-diff can get more complicated, but the simple version isn't too bad.
Thanks to Dr. Erica Blom for valuable discussion and references on this topic.
See also
- Four “back door” regression situations: What should be in your regression?
- Simple Front Door Regression
- A simple Instrumental Variable