NYC standardized test results: Checking out the number of students tested in Math and ELA
Thursday November 14, 2013
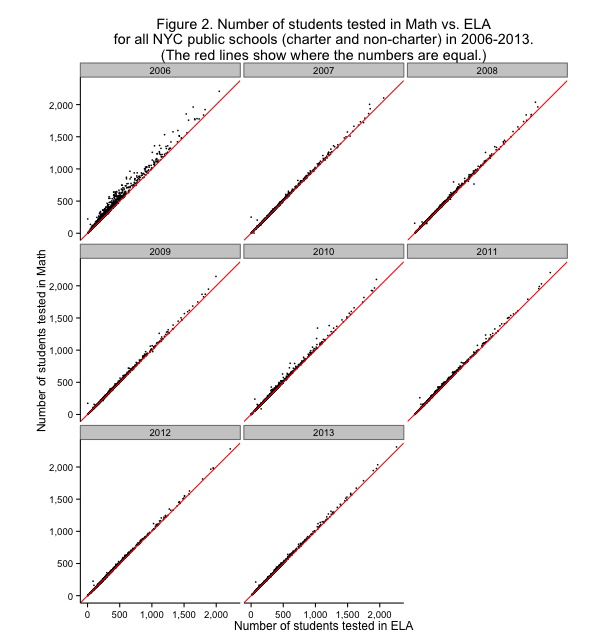
Figure 2. Number of students tested in Math vs. ELA for all NYC public schools (charter and non-charter) in 2006-2013. (The red lines show where the numbers are equal.)
As noted earlier, the number of students who have test results reported could itself be interesting. A bit of examination is in order.
A check of whether the number of students tested in each grade adds up to the number of students tested in "All Grades" reveals that... it's so close to perfect. There's only one obvious inconsistency:
   dbn      grade year subject  n score
22K245          3 2007     ELA 21   661
22K245          4 2007     ELA  1    NA
22K245          5 2007     ELA 24   655
22K245 All Grades 2007     ELA  1    NA
(The issue is that 21 + 1 + 24 is not 1.) Something weird is going on here; the number for fourth grade could be wrong too. Who knows? The moral of the story is: don't use the provided n for "All Grades" - add it up yourself.
One interesting thing is that very occasionally a school will test some students in one subject but test no students in the other.
   dbn year Math ELA
09X413 2006   NA  31
75K077 2006   NA   2
75X012 2010    1  NA
75X012 2011    1  NA
84K701 2006  102  NA
84M704 2006  164  NA
84Q704 2006  293  NA
It's a little interesting that three of these are from two District 75 schools, which do special education exclusively. Many of their students don't take these tests, as I understand it. Three more of these records are from Charter schools, which is indicated by "84" in their district space. Perhaps they just didn't have their act together in 2006, or had some exemption from the ELA exam? I don't have any particular theory for 09X413. There are probably many more cases such as this at the school grade year level; I'm not too concerned about it for the moment.
At the school year level, the number of students tested in ELA and Math is exactly the same for only 14% of records. To get a feel for how the number tested in Math relates to the number tested in ELA, we can plot these numbers against each other, as also shown at top:
Figure 2. Number of students tested in Math vs. ELA for all NYC public schools (charter and non-charter) in 2006-2013. (The red lines show where the numbers are equal.)
Where there are differences it's usually more students taking the Math test than the ELA test. One possible reason for this could be English Language Learners who are somehow "excused from" the ELA test but still take the Math test. Perhaps this was allowed particularly in 2006, which seems to have been a free-for-all when it came to not testing students in ELA. One wonders if schools ever make any sort of effort to keep certain students from testing. At least the numbers are close, especially for the last several years. The persistent outlier even in 2011-2013, clearly apparent toward the bottom of those graphs, is 30Q235:
   dbn year Math ELA
30Q235 2006  222   3
30Q235 2007  251   1
30Q235 2008  156   1
30Q235 2009  174   3
30Q235 2010  239  58
30Q235 2011  260  81
30Q235 2012  225  86
30Q235 2013  213  72
30Q235 is a middle school, the Academy for New Americans. Perhaps they can be excused from the ELA exam.
[table of contents for this series]
This post was originally hosted elsewhere.