Hearing Data with Sonic Histograms
Monday December 14, 2015
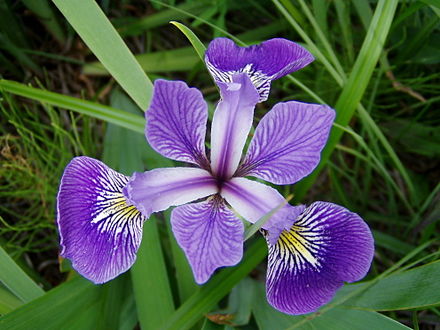
You can see an iris, and you can smell an iris, and you can measure the length and width of 150 iris sepals and petals... but can you hear the iris data?
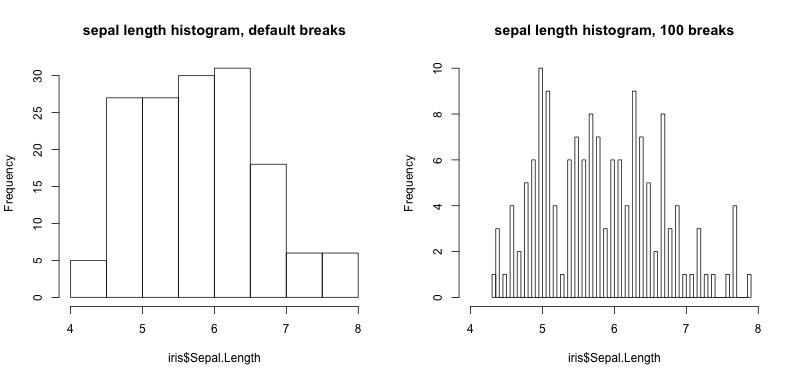
Histograms are a great way to get a sense for the distribution of a set of values. The view you get depends on how wide your bars are.
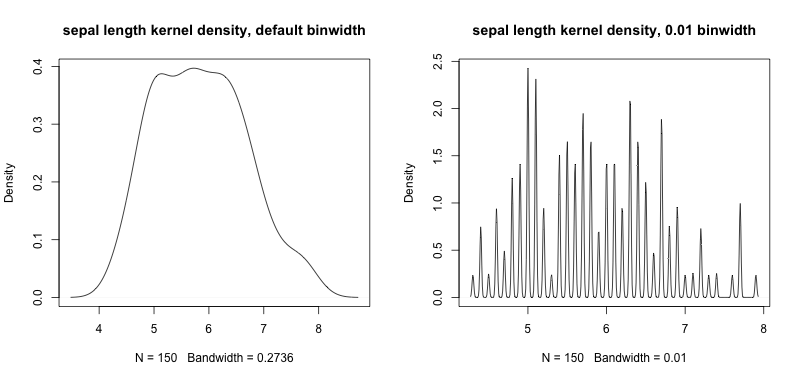
Both those histograms look pretty good, but audio isn't so boxy. A cousin of the histogram, kernel density estimation (KDE) seems more like audio. Like a histogram, it can be more or less "smooth".
Stealing the idea of KDE, we can adapt it for audio. We'll just add up audio pulses that are positioned in time to represent values.
We can use "wide" audio points or "narrow" audio points .
Combining a bunch of wide audio points, we get a "smoother" audio histogram. And if we combine narrow audio points, we get a more "discrete" sounding histogram.
Adding an audio axis label and some sonic tick marks, we get serviceable audio histograms that you can compare to their visible counterparts.
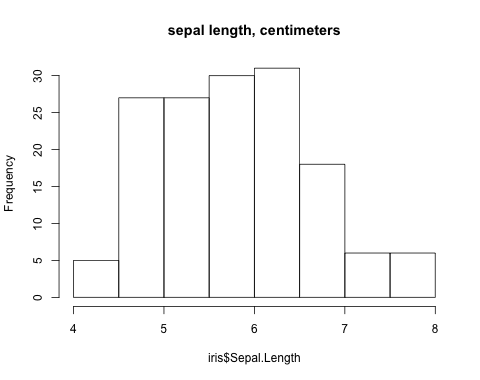
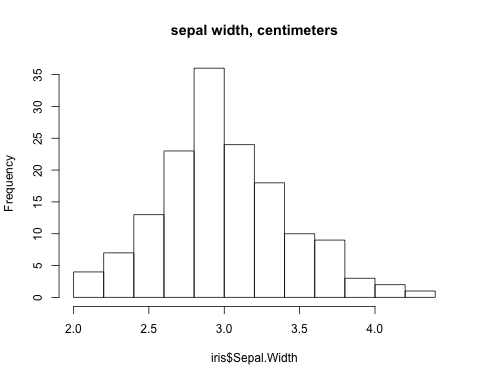
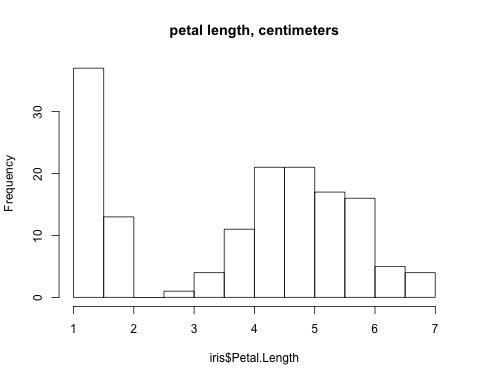
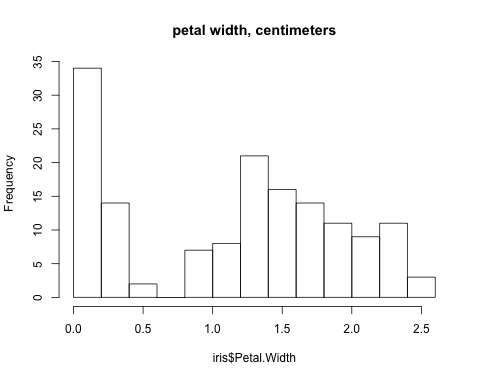
So yes, it kind of works! You can certainly hear bimodality, and even differentiate between the first two distributions if you listen carefully. I probably won't switch from visualizations to sonifications, but it's a fun things to explore!
Thanks to Spotify's Monthly Music Hackathon NYC (@musichackathon) Sound Visualization & Data Sonification Hackathon for providing the push to do this. There's video on Livestream (I'm on from about 5:30 to 10:30) but ironically the audio doesn't seem to be working. Thanks also to Thomas Levine for showing me the tuneR library for R which let me jump in and start making sounds really quickly.
This code was hacked together quickly and is not what you'd call "production grade". It uses the Mac say and also ffmpeg via system, but it's otherwise R that might work for you if you want to try it.
# install.packages("tuneR")  # install if not installed
library("tuneR")
setWavPlayer('/usr/bin/afplay')  # on Mac


point_at <- function(value,  # data value
                     lowest,  # data range min
                     highest,  # data range max
                     duration,  # seconds
                     point_width,  # seconds for +/- 3 SD (points are normal)
                     point_freq=440, sample_rate=44100) {
  point_width_samples <- point_width * sample_rate
  point <- sine(point_freq, point_width_samples, stereo=TRUE)
  filter <- dnorm(seq_along(point), mean = length(point)/2, sd = length(point)/6)
  filter <- filter / max(filter)
  point <- point * filter
  duration <- duration * sample_rate
  data_range <- highest - lowest
  left_offset <- value - lowest
  peak_position <- (left_offset / data_range) * duration
  left_padding_duration <- peak_position - length(point)/2
  if (left_padding_duration > 0) {
    result <- bind(silence(left_padding_duration, stereo=TRUE), point)
  } else {
    result <- point[abs(left_padding_duration):length(point)]
  }
  if (length(result) < duration) {
    result <- bind(result, silence(duration - length(result), stereo=TRUE))
  } else {
    result <- result[1:duration]
  }
  result
}

points_at <- function(values,  # data values
                      lowest,  # data range min
                      highest,  # data range max
                      duration,  # seconds
                      point_width,  # seconds for +/- 3 SD (points are normal)
                      point_freq=440, sample_rate=44100) {
  result <- silence(duration * sample_rate, stereo = TRUE)
  for (value in values) {
    result <- result + point_at(value, lowest, highest, duration, point_width,
                                point_freq, sample_rate)
  }
  result
}

low_high <- function(values) {
  breakpoints <- pretty(values)
  lowest <- breakpoints[1]
  highest <- breakpoints[length(breakpoints)]
  c(lowest, highest)
}

normalized_sonic_hist_content <- function(values,  # data values
                                          duration=4,  # seconds
                                          point_width=0.2,  # seconds for +/1 3 SD (points are normal)
                                          point_freq=440, sample_rate=44100) {
  breakpoints <- low_high(values)
  lowest <- breakpoints[1]
  highest <- breakpoints[2]
  content <- points_at(values, lowest, highest, duration, point_width,
                       point_freq, sample_rate)
  normalize(content)
}

sonic_hist <- function(values,  # data values
                       main,  # "title" of variable
                       duration=4,  # seconds
                       point_width=0.2,  # seconds for +/1 3 SD (points are normal)
                       point_freq=440,
                       legend=TRUE,
                       units="",
                       edge=TRUE, edge_freq=880, edge_duration=1000,
                       sample_rate=44100) {
  if (missing(main)) {
    main <- deparse(substitute(values))
  }
  breakpoints <- low_high(values)
  lowest <- breakpoints[1]
  highest <- breakpoints[2]
  content <- normalized_sonic_hist_content(values, duration, point_width, point_freq, sample_rate)
  edge_sound <- sine(edge_freq, duration=edge_duration, stereo=TRUE)
  if (edge) {
    content <- bind(edge_sound, content, edge_sound)
  }
  if (legend) {
    system(paste("say", main, "in", duration, "seconds from", lowest, "to", highest, units, "-o t"))
    system("ffmpeg -i t.aiff -ar 44100 t.wav")
    legend_mono <- normalize(readWave("t.wav"), pcm=FALSE)
    legend_stereo <- stereo(legend_mono, legend_mono)
    system("rm t.aiff t.wav")
    content <- bind(legend_stereo, content)
  }
  content
}

triple_save <- function(some_wav) {
  name_prefix <- deparse(substitute(some_wav))
  wav_name <- paste(name_prefix, ".wav", sep='')
  mp3_name <- paste(name_prefix, ".mp3", sep='')
  ogg_name <- paste(name_prefix, ".ogg", sep='')
  writeWave(some_wav, wav_name)
  system(paste("ffmpeg -i", wav_name, mp3_name))
  system(paste("ffmpeg -i", wav_name, ogg_name))
  system(paste("rm", wav_name))
}

data("iris")

iris$Sepal.Length


png('two_histograms.png', width=800, height=380)
par(mfrow=c(1, 2))
hist(iris$Sepal.Length, main="sepal length histogram, default breaks")
hist(iris$Sepal.Length, breaks=100, xlim=c(4, 8), main="sepal length histogram, 100 breaks")
dev.off()

png('two_kdes.png', width=800, height=380)
par(mfrow=c(1, 2))
plot(density(iris$Sepal.Length), main="sepal length kernel density, default binwidth")
plot(density(iris$Sepal.Length, bw=0.01), main="sepal length kernel density, 0.01 binwidth")
dev.off()

sonic_point_wide <- point_at(value=4, lowest=0, highest=8, duration=2, point_width=0.5)
triple_save(sonic_point_wide)
sonic_point_narrow <- point_at(value=4, lowest=0, highest=8, duration=2, point_width=0.05)
triple_save(sonic_point_narrow)

sonic_sepal_length_wide <- sonic_hist(iris$Sepal.Width, legend=F, edge=F, point_width=0.4)
triple_save(sonic_sepal_length_wide)
sonic_sepal_length_narrow <- sonic_hist(iris$Sepal.Width, point_width=0.05, legend=F, edge=F)
triple_save(sonic_sepal_length_narrow)

sonic_tick_mark <- sine(880, duration=1000, stereo=TRUE)
triple_save(sonic_tick_mark)

png("sepal_length.png", height=380, width=480)
hist(iris$Sepal.Length, main="sepal length, centimeters")
dev.off()
sonic_sepal_length <- sonic_hist(iris$Sepal.Length, main="sepal length", units="centimeters")
triple_save(sonic_sepal_length)

png("sepal_width.png", height=380, width=480)
hist(iris$Sepal.Width, main="sepal width, centimeters")
dev.off()
sonic_sepal_width <- sonic_hist(iris$Sepal.Width, main="sepal width", units="centimeters")
triple_save(sonic_sepal_width)

png("petal_length.png", height=380, width=480)
hist(iris$Petal.Length, main="petal length, centimeters")
dev.off()
sonic_petal_length <- sonic_hist(iris$Petal.Length, main="petal length", units="centimeters")
triple_save(sonic_petal_length)

png("petal_width.png", height=380, width=480)
hist(iris$Petal.Width, main="petal width, centimeters")
dev.off()
sonic_petal_width <- sonic_hist(iris$Petal.Width, main="petal width", units="centimeters")
triple_save(sonic_petal_width)
If you're having any problems with your sonic histograms, you can adjust them with a sonic screwdriver.