A micro-intro to ggmap
Sunday February 23, 2014
This describes what we did in the break-out session I facilitated for the illustrious Max Richman's Open Mapping workshop at Open Data Day DC. For more detail, I recommend the original paper on ggmap.
ggmap is an R package that does two main things to make our lives easier:
- It wraps a number of APIs (chiefly the Google Maps API) to conveniently facilitate geocoding and raster map access in
R. - It operates together with
ggplot2, anotherRpackage, which means all the power and convenience of the Grammar of Graphics is available for maps.
To install ggmap in R:
install.packages("ggmap")Then you can load the package.
library("ggmap")

## Loading required package: ggplot2
One thing that ggmap offers is easy geocoding with the geocode function. Here we get the latitude and longitude of The World Bank:
address <- "1818 H St NW, Washington, DC 20433"
(addressll <- geocode(address))

##      lon  lat
## 1 -77.04 38.9
The ggmap package makes it easy to get quick maps with the qmap function. There are a number of options available from various sources:
# A raster map from Google
qmap("Washington, DC", zoom = 13)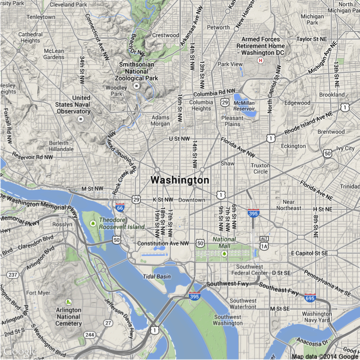
# An artistic map from Stamen
qmap("Washington, DC", zoom = 13, source = "stamen",
     maptype = "watercolor")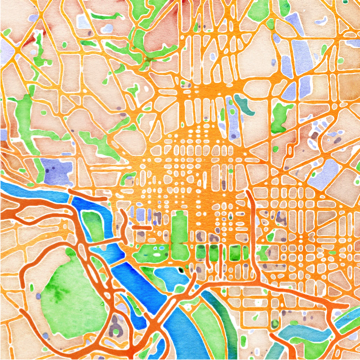
Since we were at The World Bank, here's a quick map showing where we were. This shows for the first time how ggplot2 functions (geom_point here) work with ggmap.
bankmap <- qmap(address, zoom = 16, source = "stamen",
                maptype = "toner")
bankmap + geom_point(data = addressll,
                     aes(x = lon, y = lat),
                     color = "red",
                     size = 10)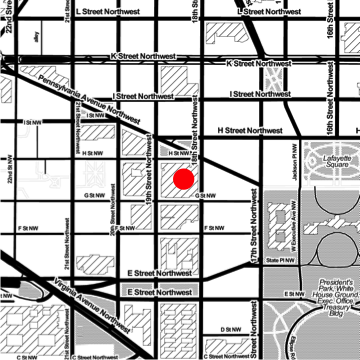
To connect with Max's demo, we can load in his data about cities in Ghana.
ghana_cities <- read.csv("ghana_city_pop.csv")We'll pull in a Google map of Ghana and then put dots for the cities, sized based on estimated 2013 population.
ghanamap <- qmap("Ghana", zoom = 7)
ghanamap + geom_point(data = ghana_cities,
  aes(x = longitude, y = latitude,
      size = Estimates2013), color = "red") +
  theme(legend.position = "none")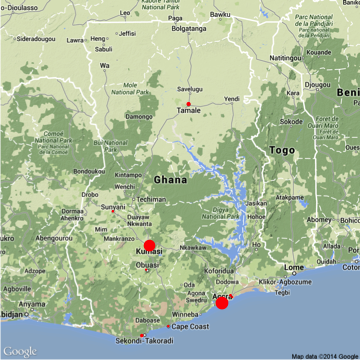
Another useful feature to note is the gglocator function, which let's you click on a map and get the latitude and longitude of where you clicked.
gglocator()This is all just the tip of the iceberg. You'll probably want to know more about ggplot2 if you're going to make extensive use of ggmap. RMaps is another (and totally different) great way to do maps in R.
This document is also available on RPubs.
This post was originally hosted elsewhere.