NYC standardized test results: Changes in average scores by year - where is the Common Core shake-up?
Wednesday November 20, 2013
New York City had changed Math and ELA tests in 2013, aligning them to the Common Core. This was billed as representing a big shift, testing deeper concepts and so on. We've seen that the distribution of scores shifted down dramatically in 2013, and results aren't being reported for District 75 schools any more. Also percent proficient is down a lot, but that's like saying more people are now shorter than a stick you raised in the air, so I'm not paying it any mind. The overall position of the distribution of scores is also pretty much arbitrary. It would be interesting if we saw changes in school grade position in the distribution change more from 2012 to 2013 than between other years, indicating that the tests changed more from 2012 to 2013 than between other years. Do we see this?
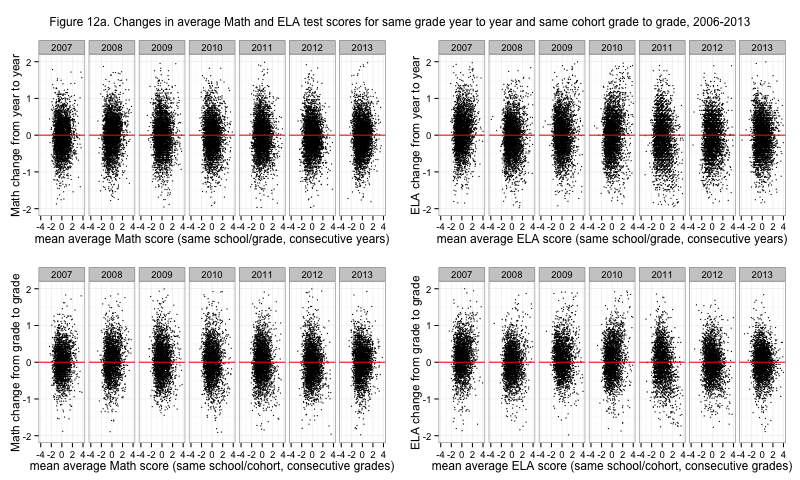
Figure 12a. Changes in average Math and ELA test scores for same grade year to year and same cohort grade to grade, 2006-2013
Nope. What if we use this other technique to give our eyes some help?

Figure 12b. Density of changes in average Math and ELA test scores for same grade year to year and same cohort grade to grade, 2006-2013
Still nope. If anything, the 2013 results resembled the 2012 results more than other years have. Any way you look at it, the 2013 tests don't seem to have shuffled NYC schools any more than other years' tests. Of course, this would be more meaningful if there was in general less shuffling with every new test administration. I'm still not over how little stability there is in the school average scores.
[table of contents for this series]
This post was originally hosted elsewhere.